How to Generate Employee Productivity Reports?
This article is a machine-translated draft and will be reviewed shortly.
The “Employee Productivity” section under the Reports tab is a comprehensive tool you can use to take a closer look at your employees’ productivity.
With these reports, you can analyse in more detail the activities your employees carry out daily, weekly, or monthly.
These reports can be generated for different time ranges (daily, weekly, monthly, yearly, or a specific date range), and you can perform more detailed reviews by exporting the report to an Excel file.

While generating a report, you can make an employee selection.
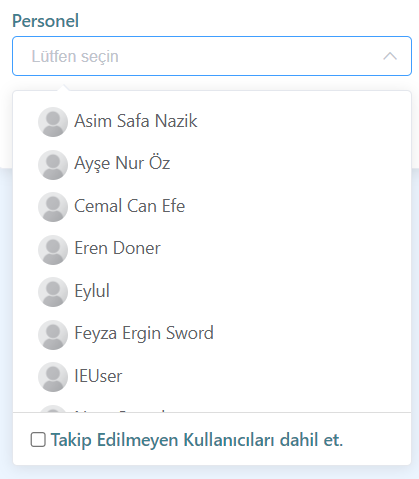
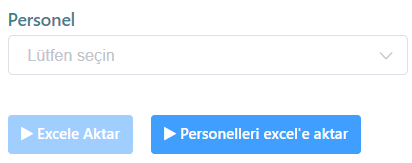
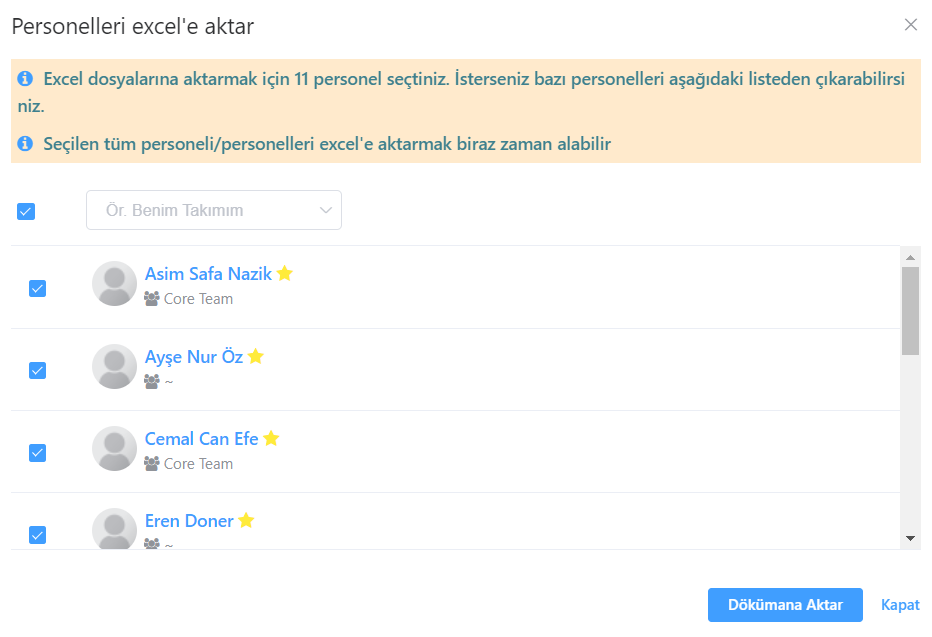
If you do not select any employee, the data of all employees registered with Berqun will be included in the report. However, when you select an employee, only the data of the selected employees will be reflected in the report. If you wish, after clicking the Export Employees to Excel button, you can select a team and choose only the employees from that team.
You can also include employees who are no longer being tracked in the report results, for example employees who have left the company. This way, the reports present a more realistic and comprehensive picture.
The BQ Score values used in the report results are presented based on 2 different calculation methods:
In these reports, unlike weekly, monthly, or yearly reports, there are 2 additional tabs for daily work. These are: Daily Activity Statistics and Daily Timeline.
How to Get the Daily Employee Productivity Report?
You can follow the steps below to get the daily productivity report of your employees from the Berqun user panel:
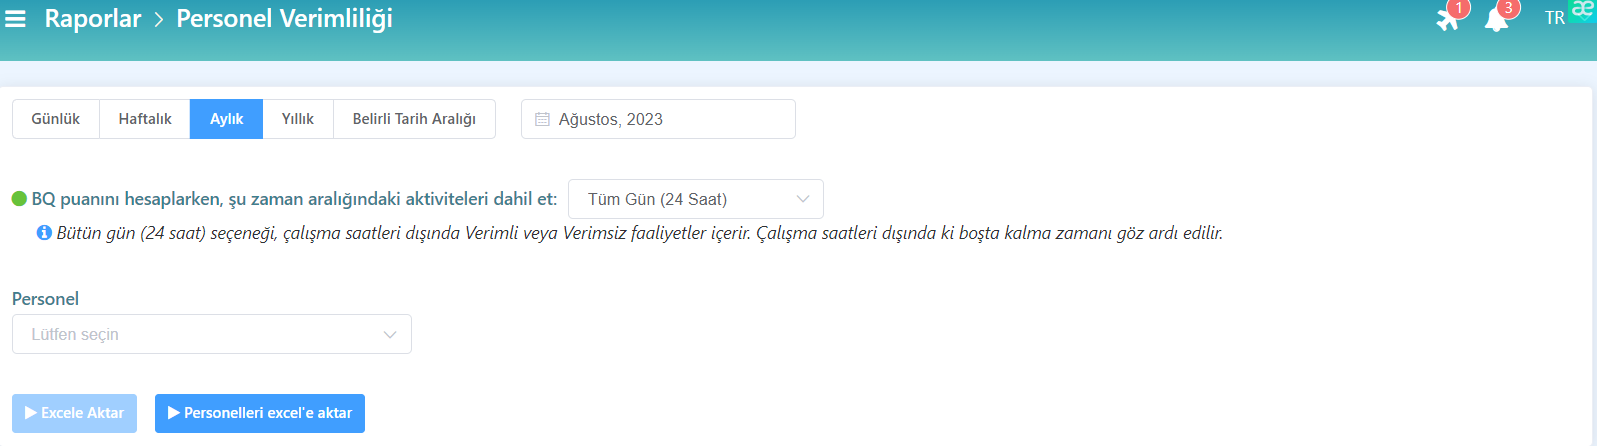
- From the user panel, go to the Reports tab and click the Employee Productivity button.
- Click the Daily option to generate the report and set a date.
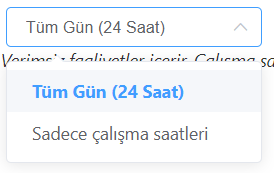
- The reports show BQ Score values as All Day (24 Hours) and Working Hours Only.
- After selecting the relevant employee, you can run the report by clicking the “Export to Excel” button.
- The report contains Daily Activity Statistics and Daily Timeline.
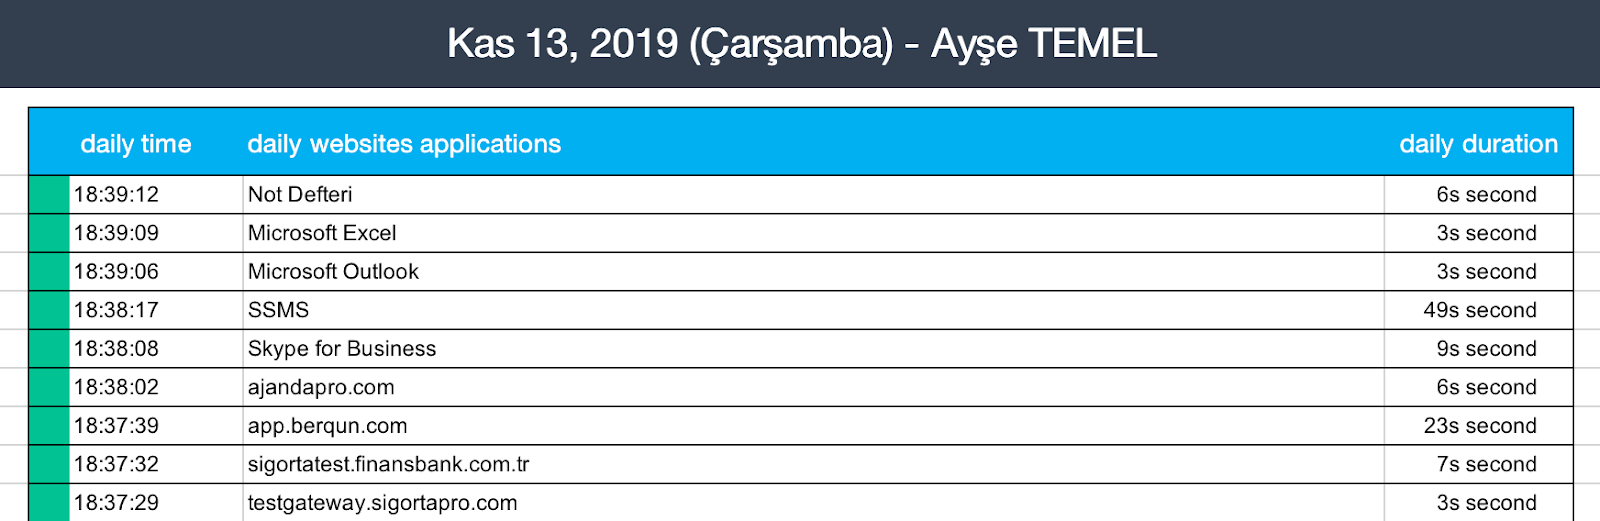
Daily Activity Statistics
The “Daily Activity Statistics” tab presents employees’ daily activity statistics in detail.
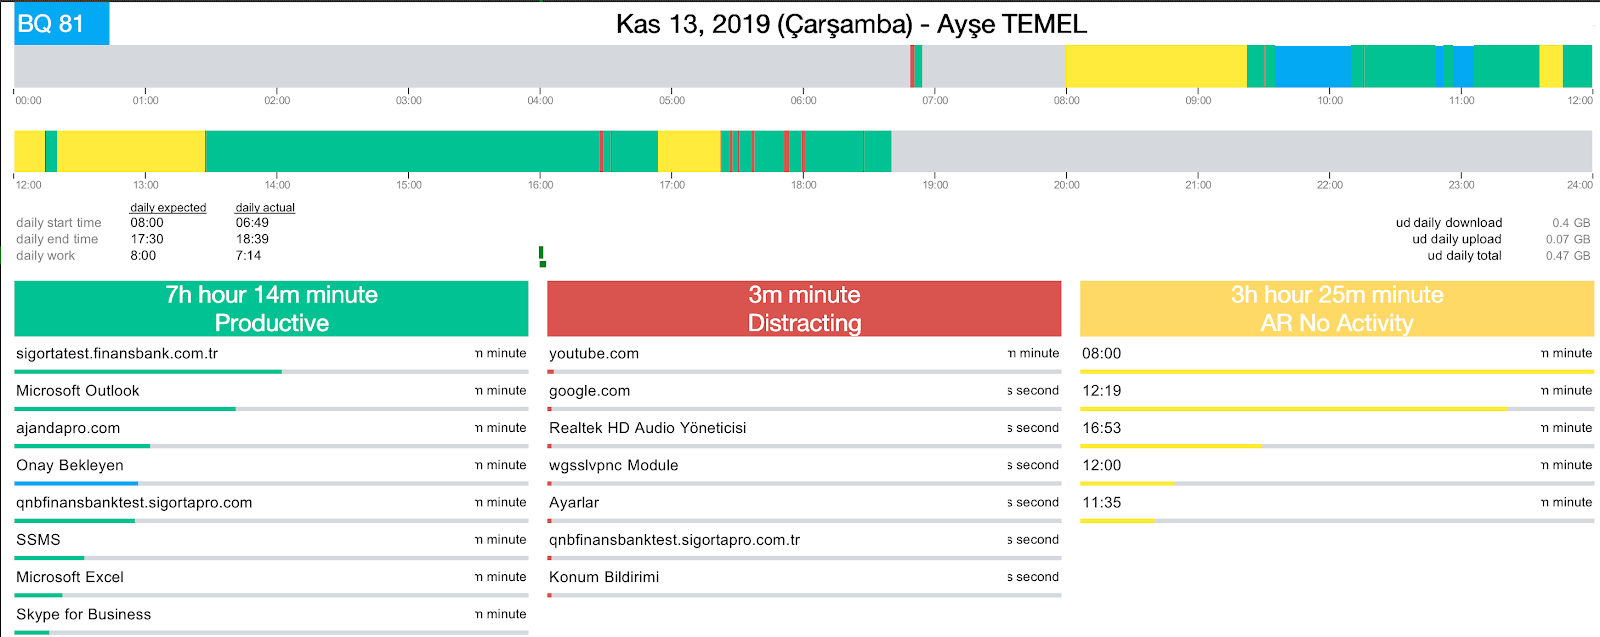
Daily Timeline
The “Daily Timeline” tab visually displays employees’ daily timelines.
How to Get the Weekly, Monthly, Yearly Employee Productivity Reports?
You can follow the steps below to get the weekly, monthly, and yearly productivity report of your employees from the Berqun user panel:
- From the user panel, go to the Reports tab and click the Employee Productivity button.
- Click the appropriate option among Daily, Weekly, Yearly, or Specific Date Range to generate the report and set the time.
- The reports show BQ Score values as All Day (24 Hours) and Working Hours Only.
- After selecting the relevant employee, you can run the report by clicking the “Export to Excel” button.
In this report type, unlike the daily report, there are 4 different tabs in Excel. These tabs are:
- List View,
- Activity Statistics,
- BQ Score Chart,
- Hours Spent Chart
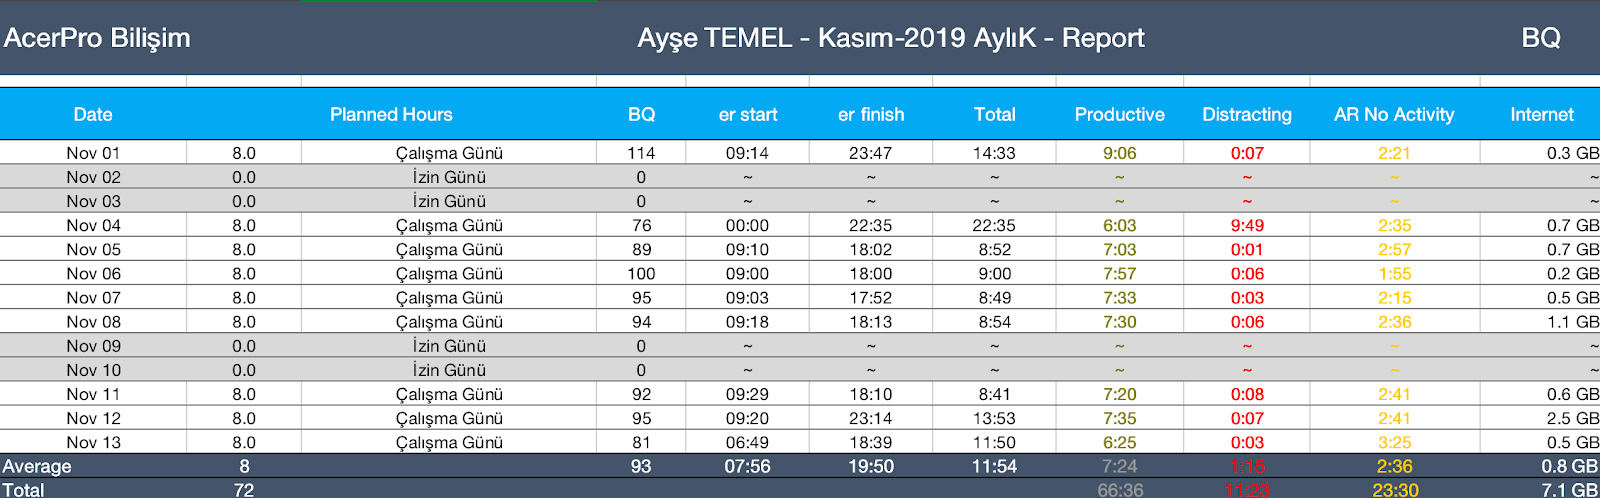
List View
This tab presents your employees’ activities within the date range you selected as a list. This list contains many pieces of information including dates, working hours, working days, BQ Score, and the start and end times of work.
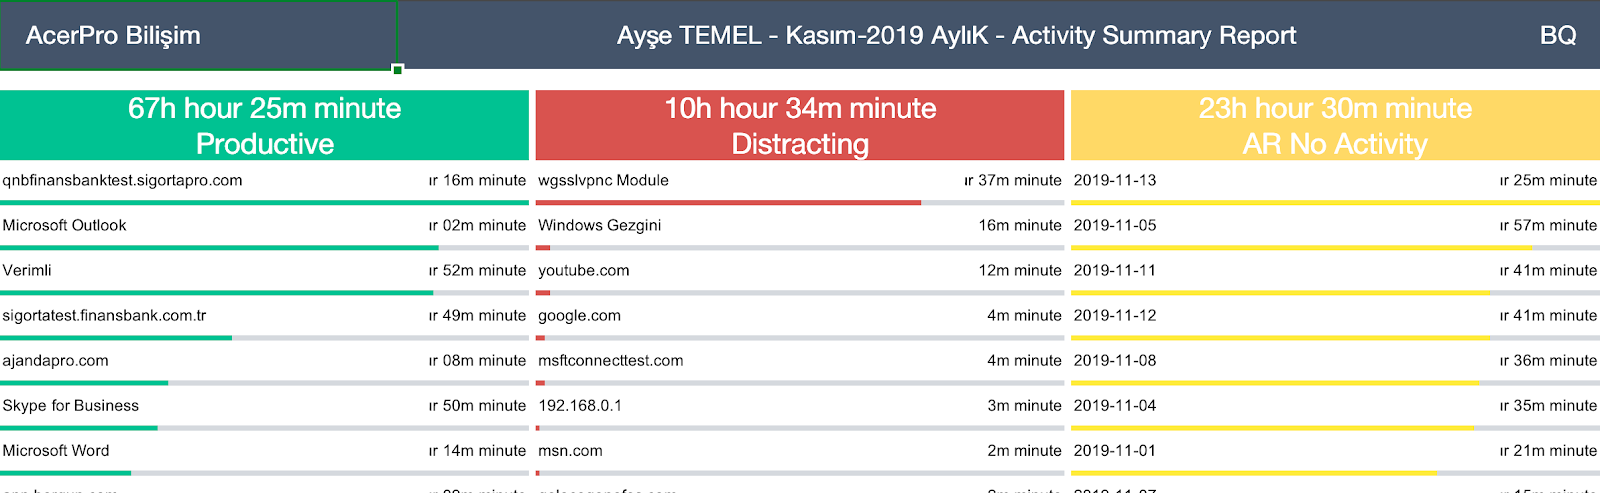
Activity Statistics
This tab shows the total activity durations and the applications used within the period you specified. While displaying these applications, it also lists them as productive and unproductive and shows idle time durations.
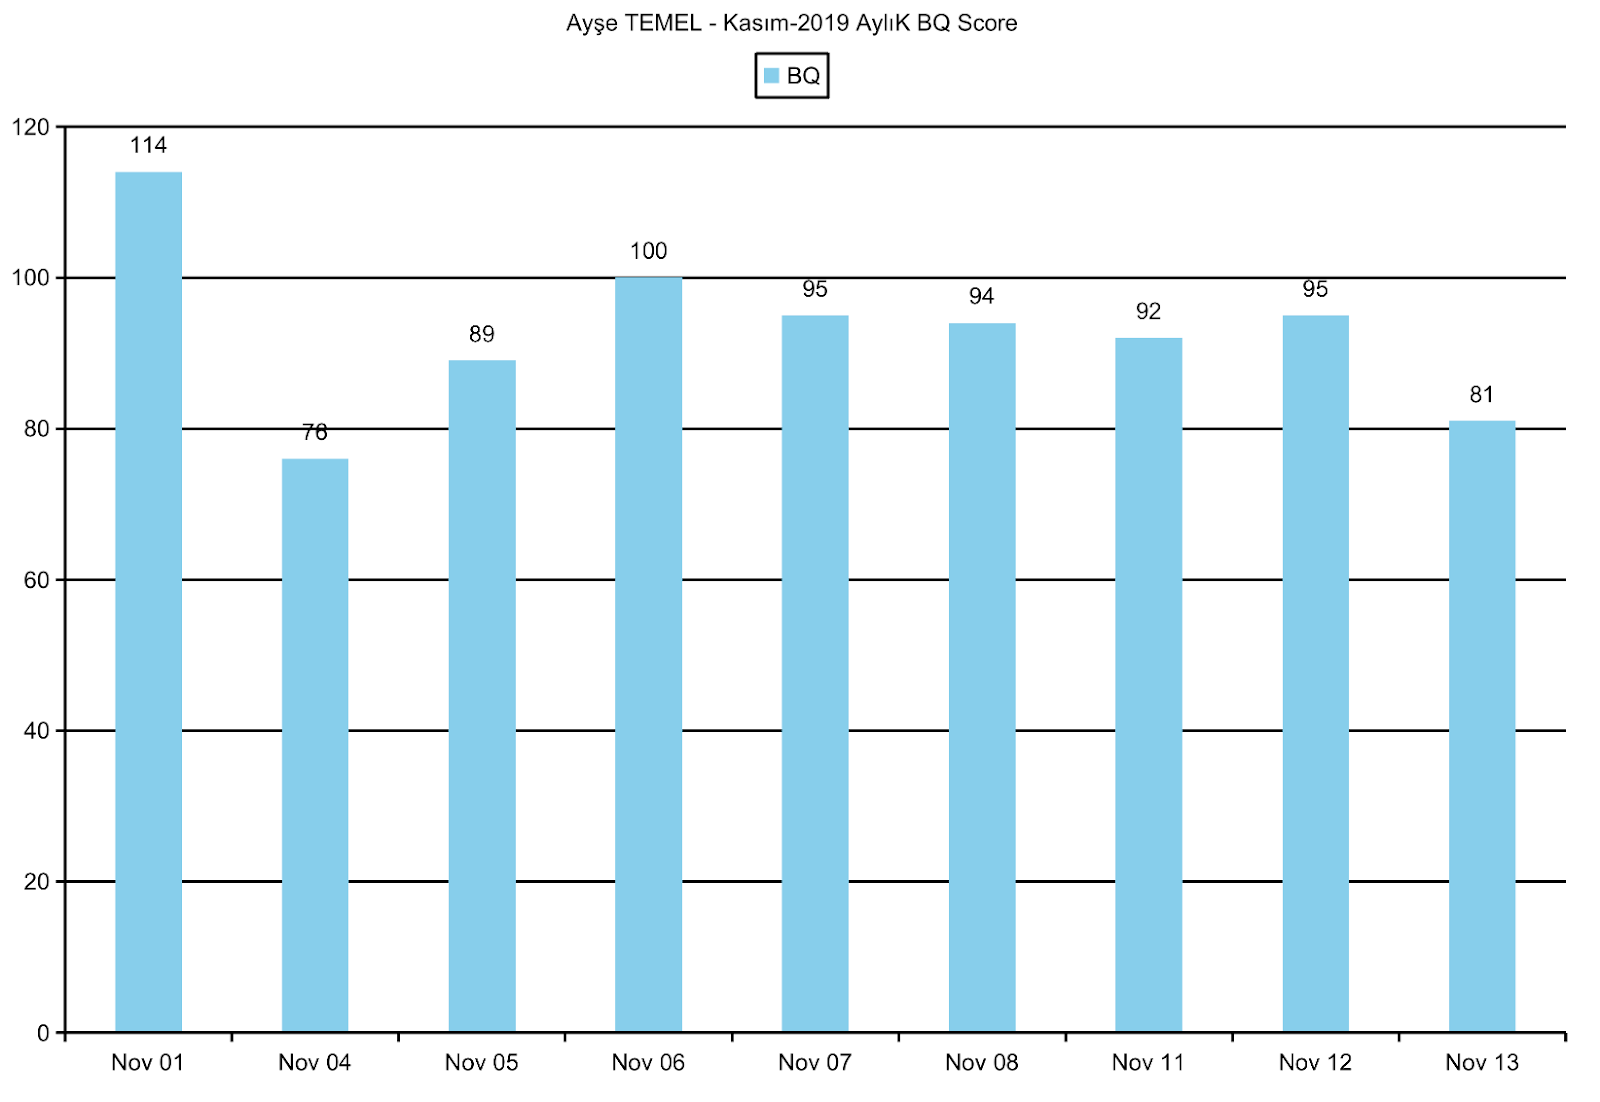
BQ Score Chart
This tab presents your employees’ BQ Scores within the periods you specified as a chart.
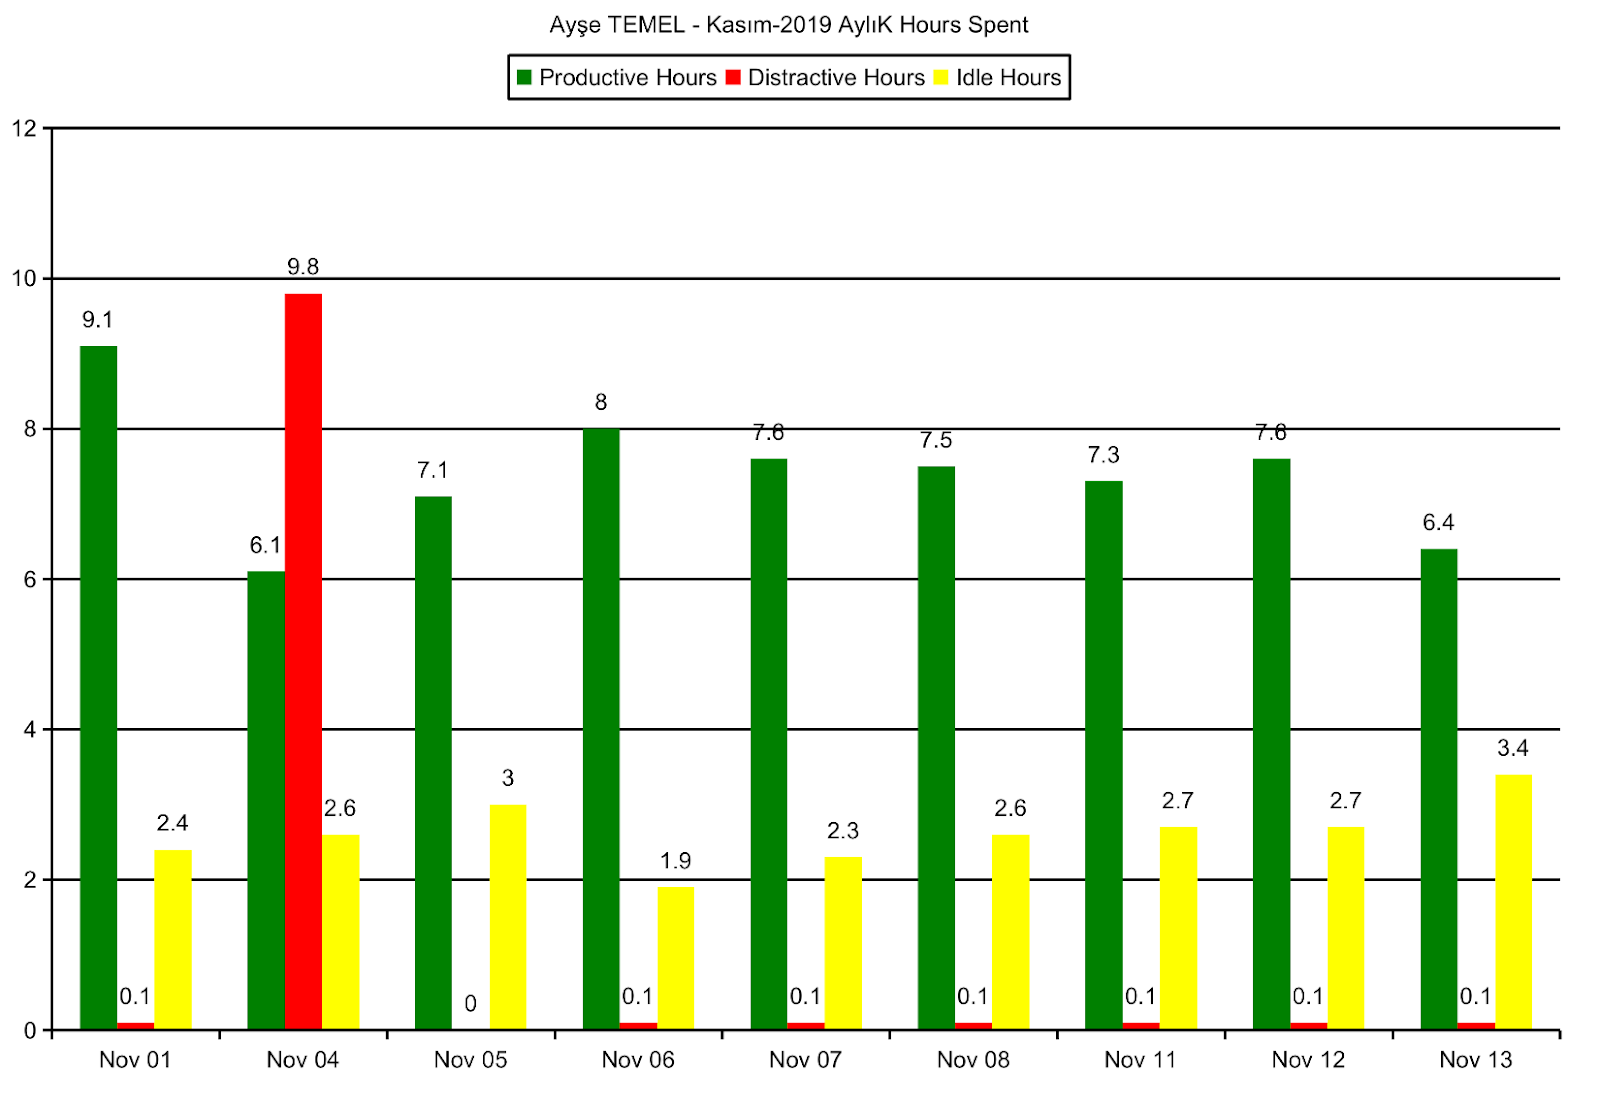
Hours Spent Chart
This tab presents your employees’ productive, unproductive, and idle working hours within a specific period as a chart.
You may also be interested in: How to Get the Office Activities Report?