

Employee productivity,
on one screen.
Understand your team's day from one place. Leave, meetings, training and working time come together on the same timeline.
No credit card required.

Activity Unproductive Idle / break Leave
Sample data Proposed activity view.
The workday fills up.
How much time is left
for the real work?
Between meetings, scattered attention and routine tasks, it gets hard to see where the time goes. Start by making your team's working pattern visible.

From clutter
to a meaningful day.
Activities are categorised automatically.

- Development
- Productive
- Communication
- Productive
- Interests
- Personal
How is time
being spent?
Follow the time your team spends on communication, development and testing over the weeks. Compare changes in how they work on the same chart.
Sample data The values in the chart are an illustrative scenario, not a real customer result.

Sample data for the five weeks from 17 August to 14 September. The meeting schedule changes in the week of 24 August. This illustrative scenario does not prove that the change caused the trend. The exact weekly values are in the table below.
Communication 4.50 → 2.35 hours.
More time for development and testing.
Sample scenario · Five weeks compared.
Same team and recording scope; no leave or shift differences.
Show the chart data as a table
| Week | Communication | Development | Test |
|---|---|---|---|
| 17 Aug | 4.50 | 2.00 | 1.00 |
| 24 Aug | 4.20 | 2.20 | 1.10 |
| 31 Aug | 3.60 | 2.60 | 1.30 |
| 7 Sep | 2.90 | 3.25 | 1.50 |
| 14 Sep | 2.35 | 3.65 | 1.65 |
Get to know
your team better.
The Office Panel shows each team's scores and top activities. The User Panel opens a person's daily activity and their BQ® score for the period.
- BQ® score
- Compares expected productivity with actual productivity. You can follow team averages side by side.
- Approval flow
- An employee asks for an app that is not yet marked productive to be counted; the manager approves or rejects the request.
- Calendar and shifts
- Define working hours, shifts and public holidays in bulk. Approve leave requests here too.
The BQ® score gives managers data for their evaluation. People still make the performance decisions.
See all featuresOffice Panel
| Team | Score bar | BQ® |
|---|---|---|
| Software | 86 | |
| Support | 81 | |
| Sales | 74 |
Top activities
- VS CodeDevelopment
- TeamsCommunication
- JiraDevelopment
User Panel
BQ® 92
Figma is waiting for approval to count as productive
What you
get with Berqun.
Fits your team's devices and the way they work.
Mac and Windows
Use Berqun on both platforms.
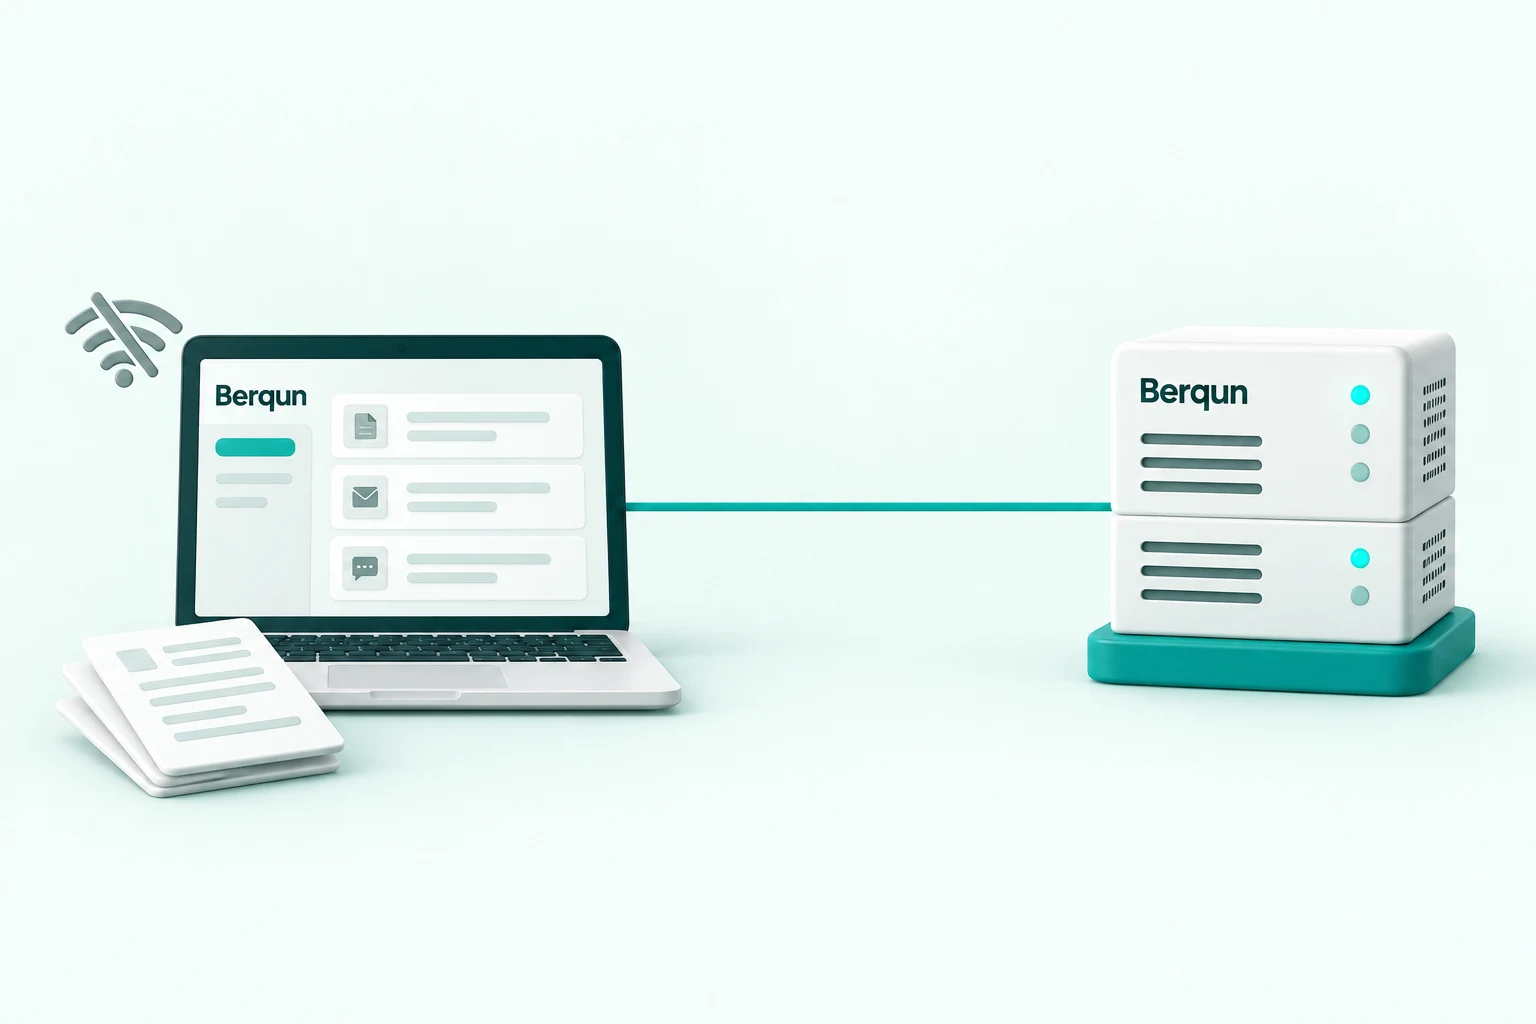
Works offline
Activity is recorded offline and sent to the server once the connection is back.
Access from anywhere
Open the office and personal panels from anywhere.
A 1 MB app
The app is about 1 MB and uses very little of the computer's resources.
Excel reports
Download productivity, activity, timesheet and overtime reports as Excel in one click. You can also receive any report by email on a schedule.
Affordable
$12.50 per user per month in the cloud, $10.42 with annual billing.
Works with the
systems you use.
Bring identity, team hierarchy and meeting data into Berqun from your existing systems.
See integrations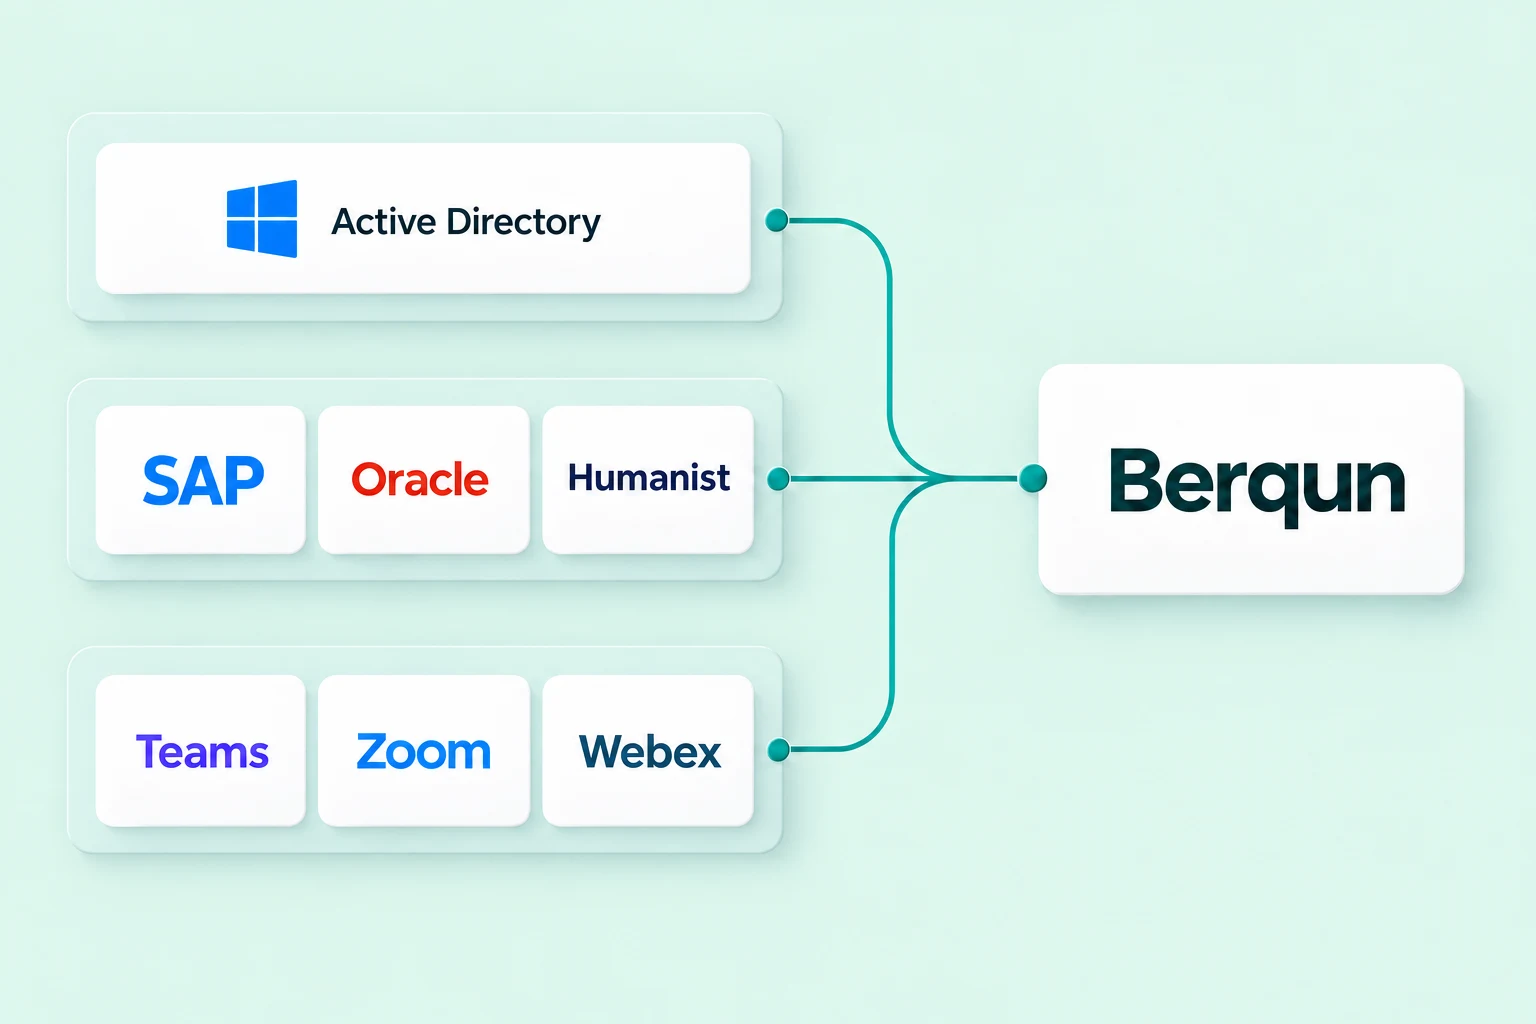 IdentityOrganisationMeetings
 Identity
Organisation
Meetings
In the cloud or
on your own servers.
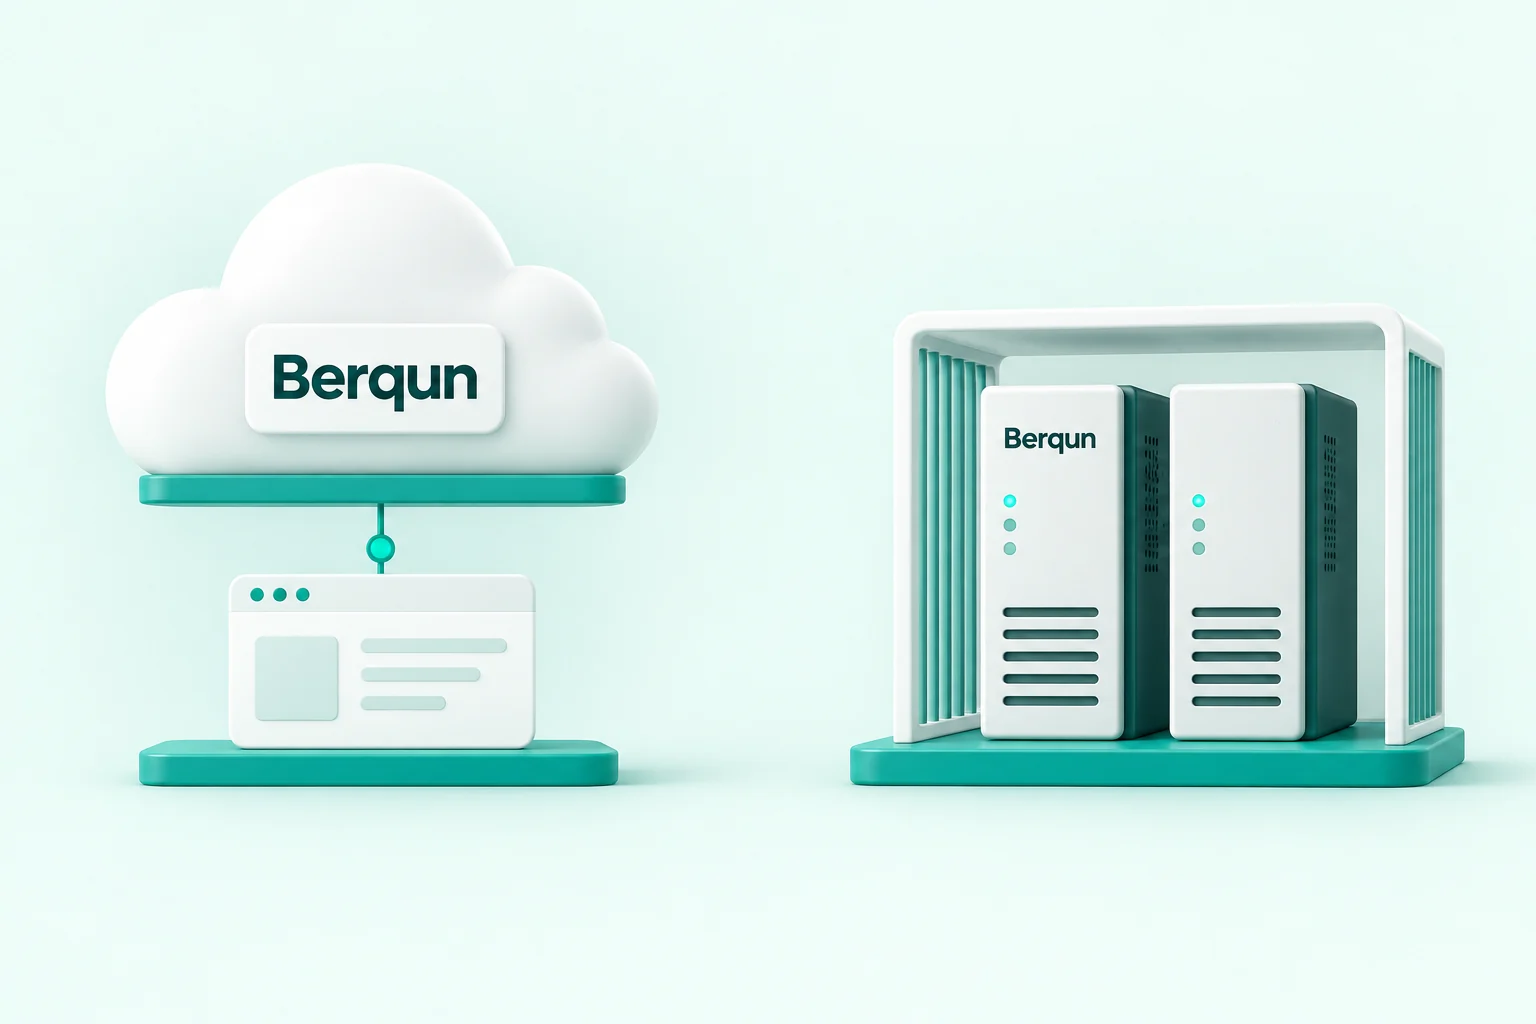
Use Berqun in the cloud or run it on your own infrastructure, whichever suits your organisation.
Pricing summary
$12.50 per user / month
$10.42 per user per month with annual billing. Data history is kept for 24 months.
Custom quote
Annual licence. Data history is kept with no time limit. Discuss setup options
Try free for 7 days
No credit card required. See pricing
GDPR and
employee data.
Set the data scope and access rights to match how your organisation uses Berqun.
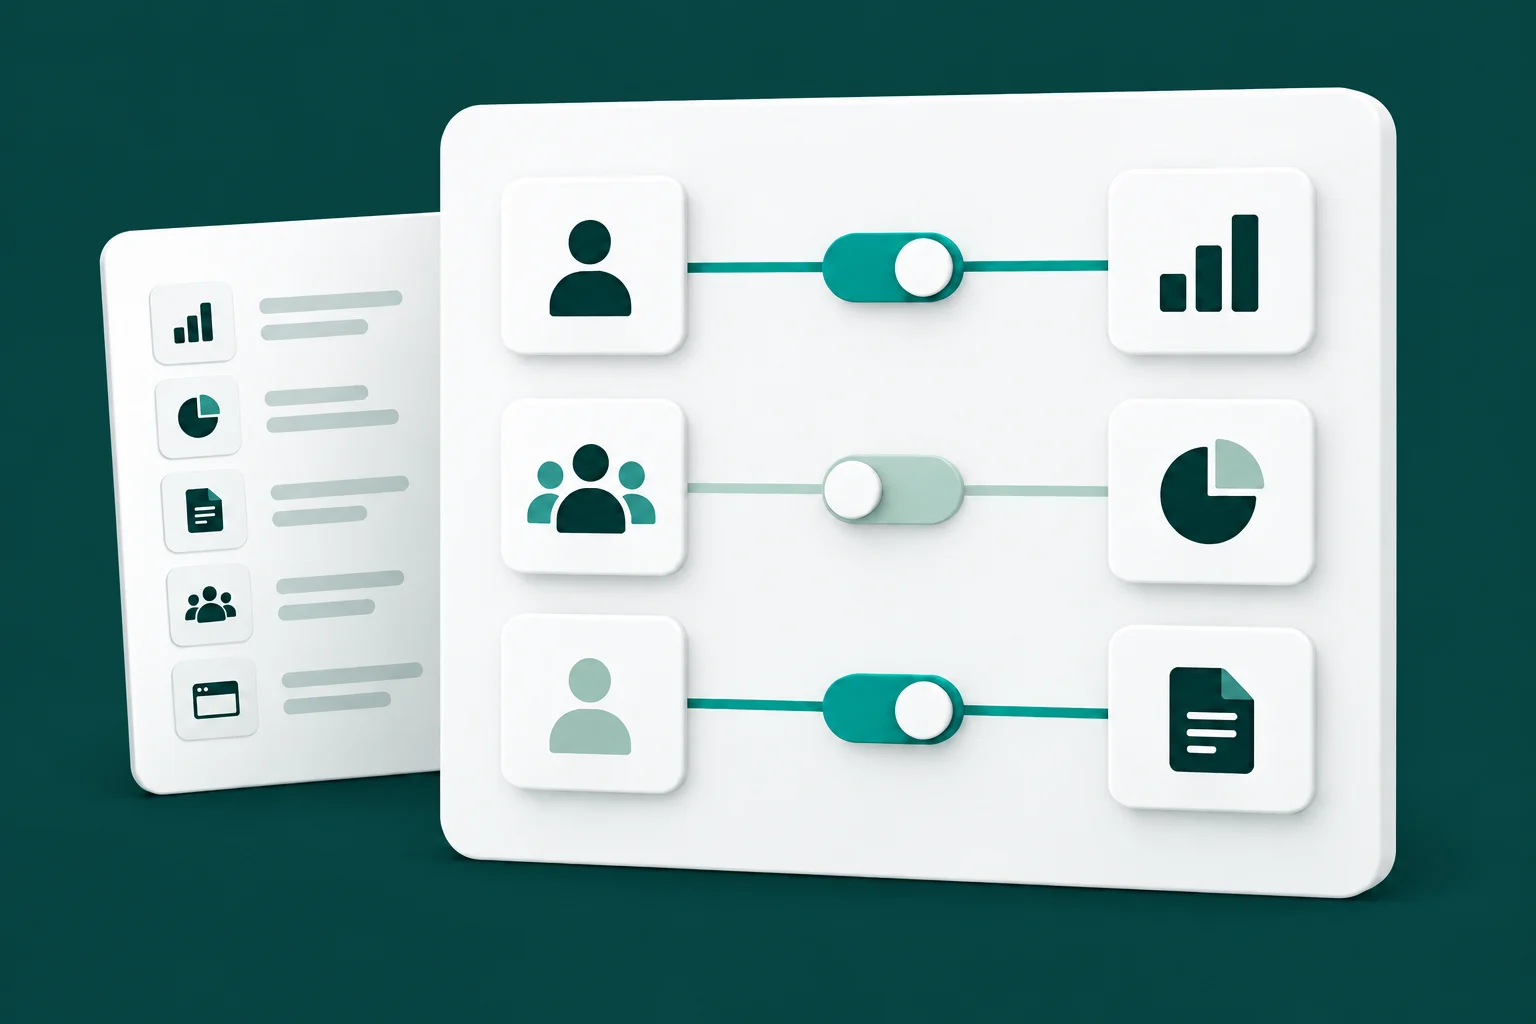
- Data scope
- Application and website usage, durations and device information.
- Permissions
- Decide who can access which module and which team's data.
- Optional features
- Screenshots and keystroke statistics run only when your organisation turns them on.
Through our
customers' eyes.
-
“I use Berqun at my company. It has a user-friendly interface and is easy for my team to use.”
Rohit C. · IT Manager
-
“This app helped me keep an eye on my office and track my team's productivity.”
Derek G. · Flight Operations Manager
-
“My team manager uses Berqun as a monitoring tool and it's helped us lift productivity as a team.”
Rahul S. · iOS Developer


See how your
team works.
See how Berqun's view fits
your own team's needs.
No credit card required.